How to Spot & Avoid Repainting Indicators in MT4/MT5
Contents
Introduction
A large group of indicators generate seemingly perfect signals once loaded onto price charts. If you run backtests only using these historical signals, you will observe an extremely high win rate. But when you deploy these indicators to live trading, you will fail to replicate the same results. This set of tools are repainting indicators, and their chart signals cannot be counted as a genuine trading edge.
What Is Repainting in Forex?
Repainting means historical signals generated by an indicator keep changing as new price fluctuations arrive. In other words, the indicator’s calculations depend on future price data. In live trading, we cannot access future prices in advance. As a result, swing highs/swing lows, arrows, and support/resistance zones drawn by these indicators will shift positions or even disappear entirely.
How Repainting Tricks Your Backtest
During backtesting, repainting indicators calculate values using fully completed historical price data, allowing them to effectively “foresee” market movement. Repainting indicators discard early failed signals and only retain entry signals that look flawless in hindsight. This creates artificially high win rates and perfect equity curves in backtest reports.
In live trading, there is no way to predict future prices beforehand. Repainting indicators continuously produce false signals, leading to completely inconsistent performance between backtest results and live execution.
Most Common Repainting Indicators (Blacklist)
ZigZag
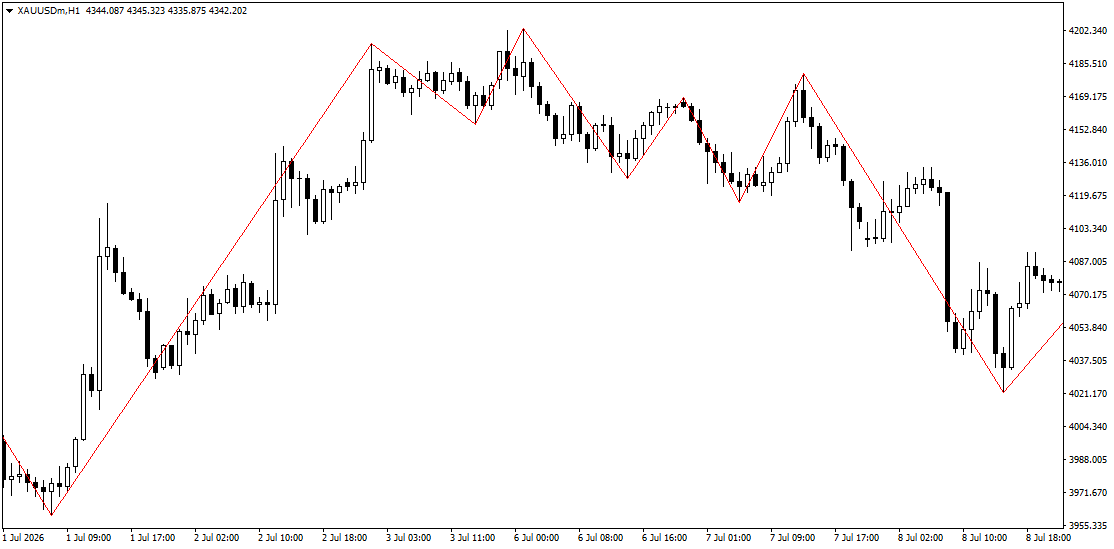
ZigZag has the most severe repaint behavior. It identifies swing highs and swing lows based on price retracement ranges, and pivot points can only be confirmed after subsequent price action finishes. While candles remain unclosed, ZigZag draws temporary pivot markers. If later price movement fails to meet the retracement threshold, previously drawn historical pivot points will shift or vanish.
During backtesting, the tester loads complete historical price data, so only final confirmed pivot points are retained.
Many indicators built upon ZigZag inherit this repaint defect. Examples include swing high and swing low detectors, automatic Fibonacci calculators, and pattern recognition indicators that rely on ZigZag logic.
Dynamic Adaptive Indicators
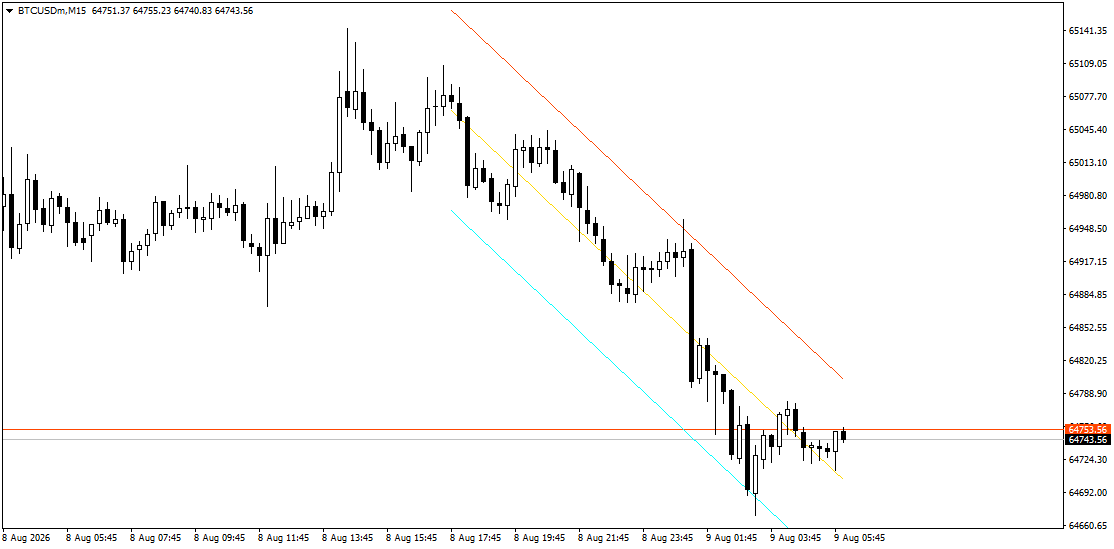
Dynamic adaptive indicators render graphics dynamically by scanning swing highs and swing lows in real time. Tools including auto support & resistance, auto trendlines and auto channels all fall into this category. As long as a candle remains unclosed, the drawn horizontal lines, sloped lines and price zones will shift, merge or vanish entirely.
Backtests load full historical price data and only preserve the final stable price zones, making all bounce and breakout signals appear flawless.
In live trading, all graphical outputs from these indicators keep adjusting continuously. Overreliance on dynamic adaptive indicators easily leads to misjudged support / resistance levels and improper market orders.
Many visual chart judgments used in discretionary trading cannot be fully quantified. All dynamic adaptive indicators are only for auxiliary reference and must not be over-relied on.
Multi-Timeframe Indicators
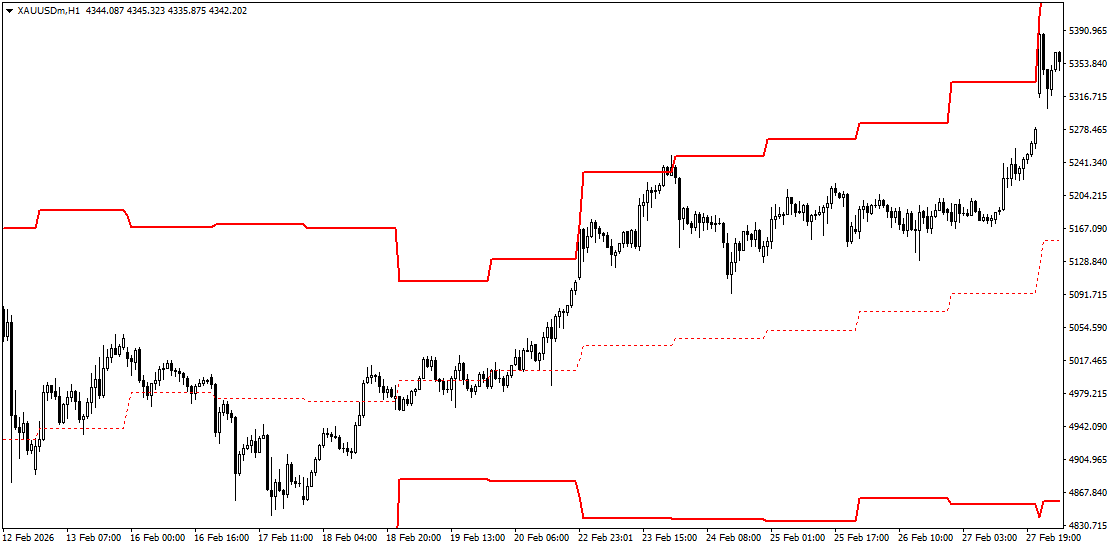
Multi-Timeframe indicators overlay unclosed high-timeframe indicator data onto low-timeframe charts. When price moves on a high-timeframe candle, all signals covering the corresponding historical range on the low-timeframe chart will change simultaneously.
Predictive / AI forecast Indicators
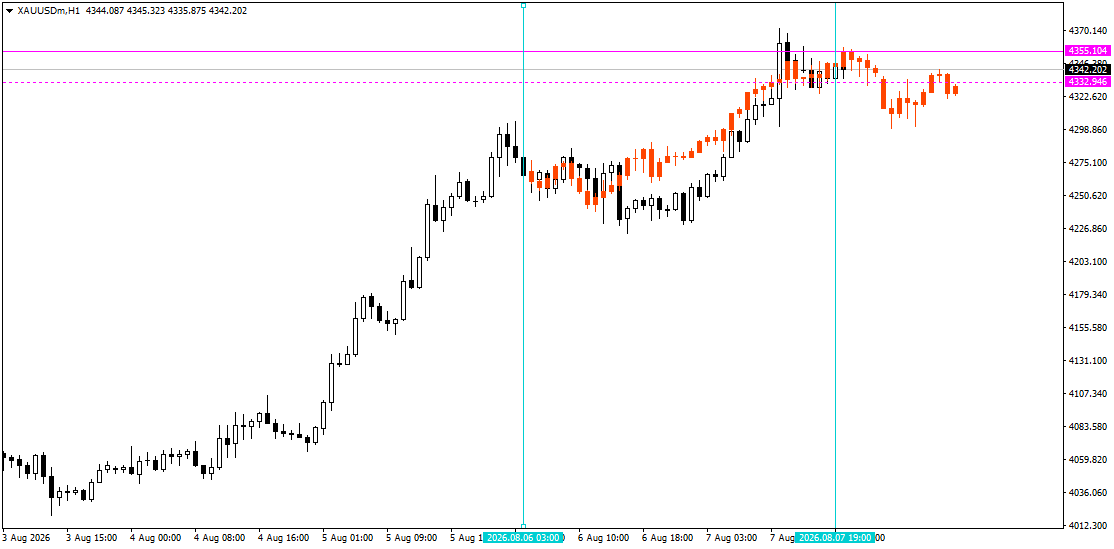
Predictive and AI forecast indicators calculate potential future price movement using a fixed window of historical candles. Any change in input price data will alter forecast outputs.
In live trading, these tools continuously revise bullish and bearish predictions based on real-time price flow, resulting in repeated rewriting of trade signals.
Custom “95% winrate” Arrow Indicators
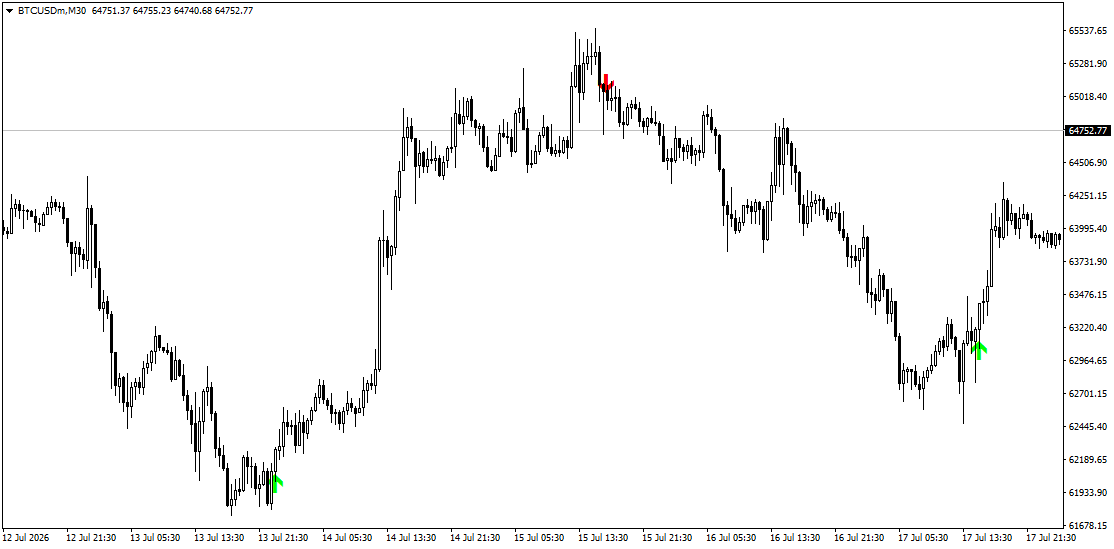
Most high-win-rate custom arrow indicators extensively use repaint logic to create the illusion of extreme win rates. These arrows pop up temporarily while candles are unclosed. If price fails to move in the expected direction, the signals will shift, reverse, or disappear entirely.
3 Fast Ways to Test Any Indicator for Repainting
Check if signals appear before candle closes
Any indicator that generates trade signals on unclosed candles can be directly judged as a repainting indicator. Intra-bar signals prove the indicator performs calculations using fluctuating incomplete data.
Screenshot comparison test
Capture a screenshot of all plotted signals on your chart. After 5 to 10 new candles fully form, compare the signals in the corresponding historical range with your screenshot. Any changed markers confirm the indicator repaints. Non-repainting indicators lock all historical markers permanently, with zero changes after new candles form.
MT4/MT5 Strategy Tester Indicator / Visual Mode
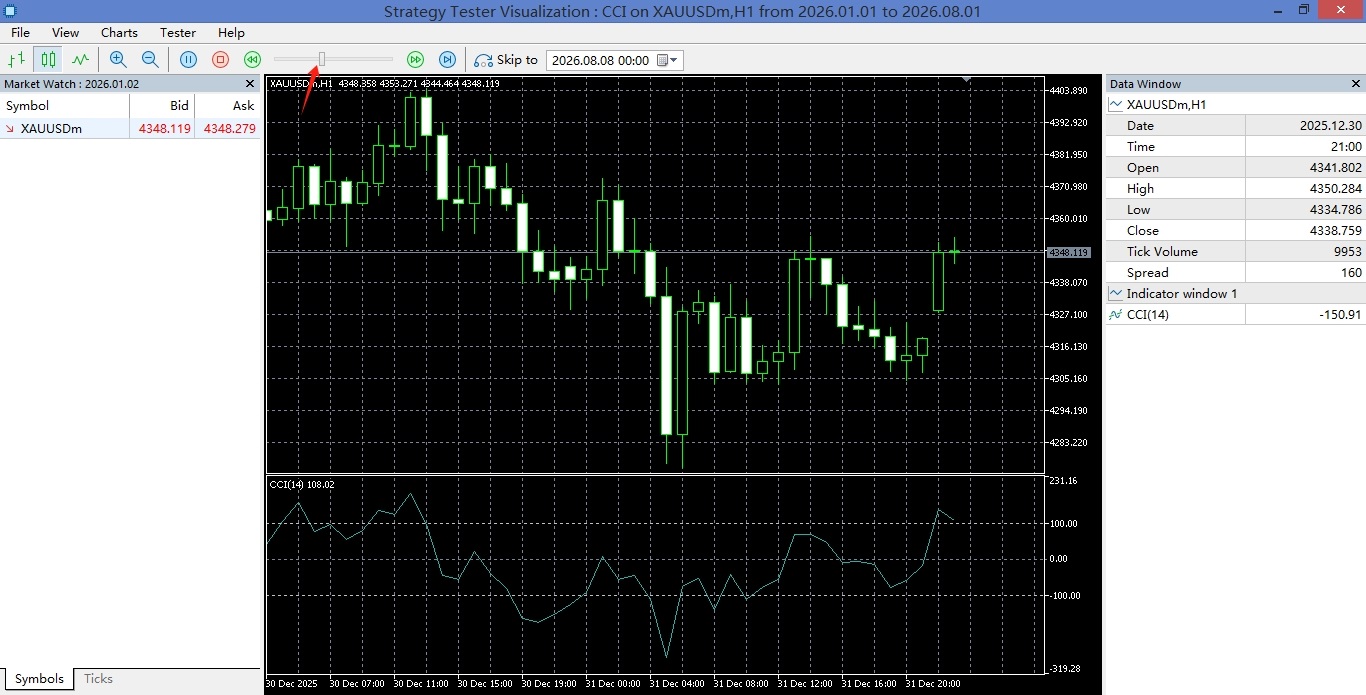
Standard backtesting loads all historical price data at one time. Repainting indicators gain full access to future candle data, automatically erase all temporary failed signals, and generate deceptive perfect backtest results. The indicator or visual replay mode simulates price action candle by candle in chronological order, replicating how indicators render signals during live trading.
Step-by-step guide for MT5:
- Click View → Strategy Tester from the top menu bar
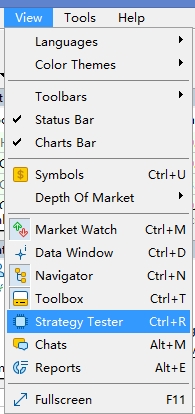
- On the opened Strategy Tester panel, navigate to Overview → Indicator

- Select the target indicator, set Modelling to Every tick, then click Start

- Slow down playback speed, and observe whether the indicator repaints historical markers as new candles form
How to Avoid Repainting Signals in Your Strategy
Only take signals on fully closed candles
This is the most critical rule to eliminate repainting at the source. No matter how tempting intra-bar signals appear, wait for full candle close before validating trade setups. This rule filters most temporary false signals.
Avoid indicators on the blacklist
All tools listed on the blacklist — ZigZag, dynamic adaptive indicators, multi-timeframe indicators, AI predictive tools, and real-time arrow indicators — shift their plotted signals, lines and zones as new candles develop. These tools cannot be used as primary entry triggers.
Use fixed-rule classic indicators
Classic native indicators such as moving averages, RSI, MACD, ATR, and Bollinger Bands follow fixed mathematical formulas. Once a candle closes, all graphical values calculated for that candle lock permanently. Strategies built with these fixed-rule indicators show minimal performance gaps between backtest and live trading.
Conclusion
Repainting is a common flaw among technical indicators. In recent years, many seemingly advanced indicators advertised for ultra-high win rates often carry repaint defects. Repainting indicators create severe performance decoupling between backtest results and live trading. Therefore, spotting and avoiding repainting indicators is a vital step when building any indicator-based trading system.
This does not mean repainting indicators are completely useless. Repainting indicators can simplify manual chart drawing and serve as auxiliary filtering tools. Always keep in mind that repainting indicators are only for reference. If you treat them as primary entry criteria, your trading logic will prove unreliable.