200 EMA + MACD crossover strategy
Contents
1. Strategy Overview
MACD crossover is one of the most commonly used entry signals in Forex and CFD trading. However, relying only on MACD often leads to two typical problems: frequent false signals and delayed entries. This is why many new traders lose money — they take every MACD crossover without filtering the market trend.
This strategy solves those flaws by combining 200-period EMA trend filtering with MACD crossover entries. We first use the 200 EMA to identify the overall market direction, then only take MACD trades that follow the main trend. This setup helps you catch high-probability entries during healthy trend pullbacks and avoid risky counter-trend trades.
Best Timeframes: All timeframes available, ideal for H1 and higher
Tradable Assets: All Forex pairs, Gold, and major mainstream trading instruments
Strategy Type: Trend-following pullback trading
2. Core Trading Logic
The entire strategy follows one simple rule: EMA defines the trend, MACD times your entry.
The 200 EMA acts as our long-term trend benchmark:
- Price above 200 EMA = Clear uptrend (only look for buy signals)
- Price below 200 EMA = Clear downtrend (only look for sell signals)
We never trade against the main trend.
Within the main trend, we wait for a natural pullback:
- In an uptrend: Price pulls back temporarily, pushing MACD fully below the zero line. This means short-term selling pressure is exhausted. A new MACD bullish crossover gives you a low-risk buy entry to catch trend continuation.
- In a downtrend: Price bounces slightly upward, pushing MACD fully above the zero line. This means short-term buying power is weak. A new MACD bearish crossover gives you a reliable sell entry.
3. Clear Entry Rules
Long (Buy) Entry Conditions
1. Price is moving above the 200 EMA (confirmed bullish trend)
2. MACD lines drop completely below the zero line (deep trend pullback)
3. Enter buy order when a bullish MACD crossover appears
Short (Sell) Entry Conditions
1. Price is moving below the 200 EMA (confirmed bearish trend)
2. MACD lines rise completely above the zero line (minor counter-trend bounce)
3. Enter sell order when a bearish MACD crossover appears
4. Simple Exit Rules
Long Trade Exit
- Stop Loss (SL): Place below the nearest recent swing low or key support level
- Take Profit (TP): Aim for a minimum 2:1 risk-reward ratio, or exit at the nearest obvious resistance / swing high
Short Trade Exit
- Stop Loss (SL): Place above the nearest recent swing high or key resistance level
- Take Profit (TP): Aim for a minimum 2:1 risk-reward ratio, or exit at the nearest obvious support / swing low
5. Strict Risk Management
Risk management determines your long-term trading survival — always follow these rules strictly:
- Per-trade risk control: Risk only 1%–2% of your total account balance per trade. Adjust your lot size based on your SL distance to fix your risk amount.
- Daily loss limit: Stop all trading for the day once your total loss hits 3%–4% of your account. This prevents emotional overtrading and big drawdowns.
- Consecutive loss rule: Pause trading immediately after 3 straight losing trades. The market is likely ranging, and this trend strategy will not work well.
- No averaging down: Never add lots to a losing position. A stopped-out trade means the setup failed — accept the loss and wait for the next clear opportunity.
6. Best Timeframes & Trading Sessions
Recommended Timeframes
- Most Suitable: H1, H4 — Clean trend structure, stable MACD signals, perfect for new and intermediate traders
- Optional: M15, M30 — More trading opportunities but slightly more false signals
- Not Recommended: M5 and lower — Too much market noise, severe signal lag, low accuracy
Best Trading Sessions
- London Session + London-New York Overlap: Highest liquidity, clear trend movement, most reliable strategy performance
- New York Session: Ideal for USD pairs and Gold trend trades
Market Conditions to Avoid
- 30 minutes before and after high-impact news (Interest rate decisions, CPI, NFP, etc.)
- Low-liquidity late Asian session with choppy sideways price action
- Flat range-bound markets with no clear up/down trend (200 EMA moving sideways)
7. Real Trading Examples
Example 1: Winning Long Trend Trade
 {width=700}
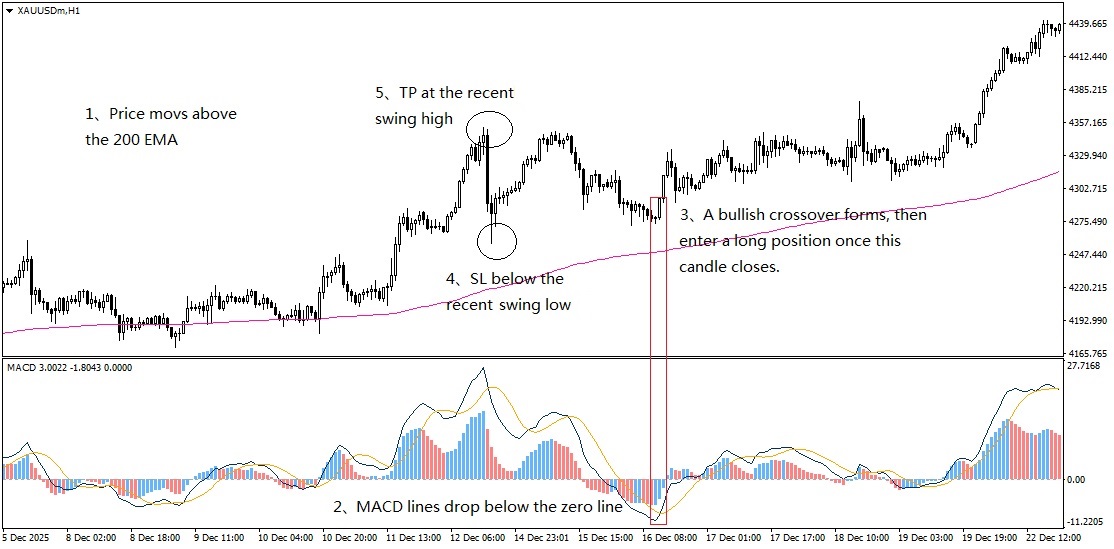
On XAUUSD H1 chart, price stably stayed above the 200 EMA, forming a solid uptrend. After a short-term pullback, MACD dropped fully below the zero line, showing exhausted selling momentum. A bullish MACD crossover formed during this pullback. We entered the long trade here.
SL was placed below the recent swing low. Price continued rising smoothly and hit the TP target.
Example 2: Winning Short Trend Trade
 {width=700}
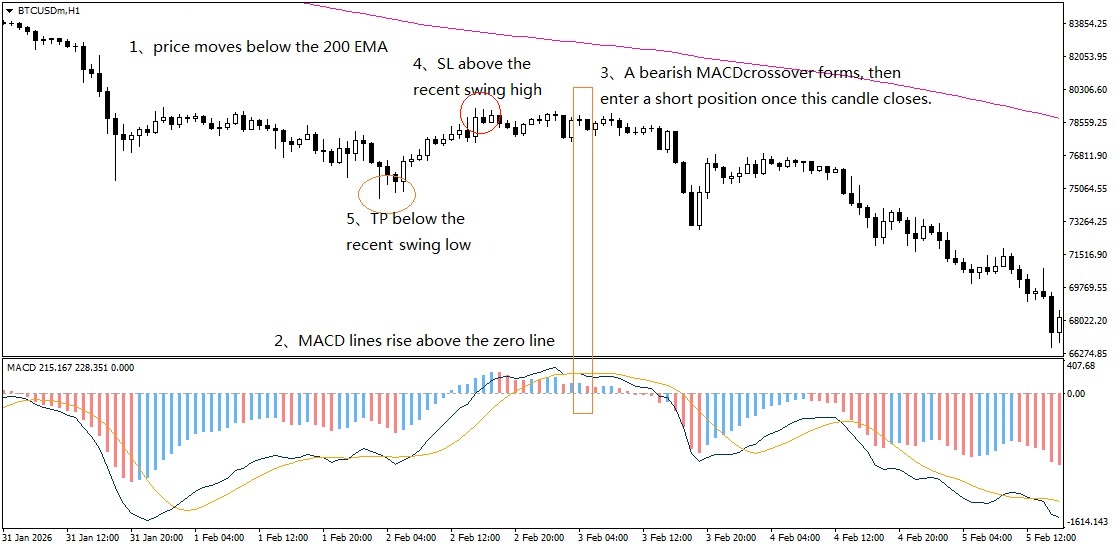
On BTCUSD H1 chart, price moved below the 200 EMA in a clear downtrend. A short-term counter-trend bounce pushed MACD above the zero line. After a bearish MACD crossover formed, triggering our short entry.
SL was set above the pullback swing high. Price dropped and reached the structural TP level.
Example 3: Losing Trade
 {width=700}
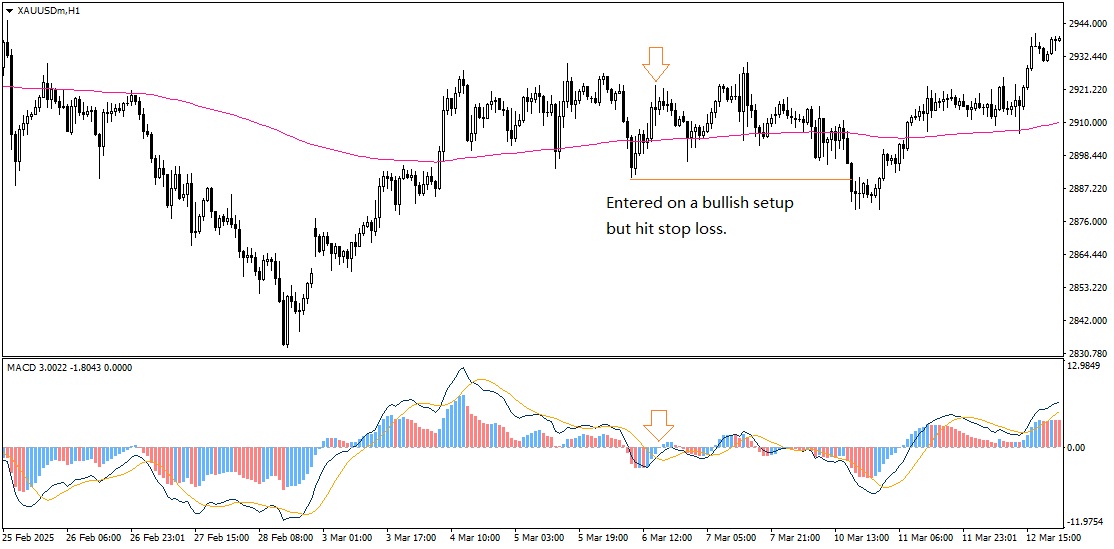
XAUUSD H1 was stuck in a tight sideways range with a flat 200 EMA (no clear trend). Price temporarily moved above the EMA and triggered a MACD bullish crossover. However, the market had no real bullish momentum.
Price reversed immediately and hit the stop loss.
8. Strategy Summary
The 200 EMA + MACD crossover strategy is a beginner-friendly, high-quality trend-following system. It filters out low-probability false MACD signals via trend confirmation, only capturing stable trend continuation setups with good risk-reward ratios.
The main limitation is poor performance in sideways ranging markets, which may cause frequent small stop losses. To improve accuracy and win rate, you can add extra filters such as ADX trend strength check, higher timeframe trend confirmation, or volume analysis to filter out noisy market signals.